")
Note (update): This article describes container freight rates in 2020–2021, when prices hit record highs due to COVID‑19 and severe supply chain disruptions. Today, rates and conditions are different, so treat this as historical context and background, not as a source of current prices.
Intro: what happened to container freight rates
In November 2020, container shipping prices started to climb sharply.
Compared with the pre‑pandemic period, rates on some routes were many times higher than before. In the media, it was common to see headlines about prices being “ten times” above the lowest levels of previous years.
Naturally, importers and retailers were asking:
– Is this the beginning of the end of cheap goods from China?
– Is this just a spike, or the new normal?
Dozens of container ships anchored off the California coast became the defining image of disrupted supply chains. Those bottlenecks were one of the key features of the post‑COVID recovery.
This situation:
- added fuel to inflation,
- slowed down economic growth,
- and raised serious questions about the global model that had dominated for three decades.
Based on data from the US at the time, there was little reason to believe that things would quickly return to “normal.”
Number of container ships off California
The number of container ships anchored or drifting in San Pedro Bay, off the ports of Los Angeles and Long Beach, hit all‑time records in mid‑September 2021.
We had already written about this in August, when a record 43 ships were waiting off the California ports. Logistics media were warning that even more ships were on the way and that congestion would worsen as the US holiday season approached.
Three weeks later, according to the Marine Exchange of Southern California, there were 73 container ships in the San Pedro Bay queue — a new record.
In practice, that meant roughly 500,000 containers were effectively “stuck.”
To picture the scale:
- if you lined up all those containers one after another,
- the line would stretch for around half the length of the US,
- from the west coast toward the east coast.
And it was not just a California problem. Other US ports were also seeing growing queues of ships waiting for a berth and discharge.
YouTube video: visual scale of the crisis
During that period, many commentators and analysts weighed in. One example was a YouTube video titled “Cargo ship crisis is artificially created – making a supply chain nightmare” (channel “iAllegedly”), showing the ports off Los Angeles, a huge number of ships waiting to unload, and a massive backlog of empty containers stacked in the port.
Footage of container ships waiting to unload off Los Angeles – a visual reminder of how big the 2020–2021 supply chain crisis really was
In the video, the author shares personal opinions that are not necessarily ours — especially when it comes to blaming China or claiming the whole crisis was “artificially created.”
Although he insists the crisis was “manufactured,” he never really explains how or points to a clear root cause. He repeatedly says that labour shortages are not the issue and makes unfounded accusations against China and the US administration, but without solid evidence.
What interested us was not his political angle, but the visuals from the ports — the sheer number of ships and containers. That’s what we wanted to share here, as a useful illustration of the scale of the problem.
Economic impact: goods stuck, time and costs running
From an economic point of view, it was a disaster: goods were not moving, but time and costs were.
For goods to move smoothly from overseas factories (mostly in China) to end customers, several elements all need to work together:
- container ships,
- shipping containers,
- cargo terminals,
- truckers,
- dispatchers,
- railways.
If this “wheel” jams at any point, the impact is felt across the entire supply chain.
At the very start of that chain are manufacturers in China.
Power shortages in China
This brings us to another issue that appeared at the same time: many factories in China were forced to stop or reduce output because of power shortages.
In that year, a “perfect storm” of factors came together:
- disruptions in coal supply,
- rising demand from industry and households,
- political tensions.
Together, they led to widespread electricity shortages across the country.
It was hard to pin down the exact mix of causes. People were asking:
- Was China deliberately saving power while ports around the world were clogged with goods?
- Or was it mainly a coal supply and energy planning problem?
China, Australia and the coal boycott
Australia is the world’s largest exporter of metallurgical (coking) coal used in steel production. For years, China relied heavily on imports of this relatively cheap, high‑quality coal.
But relations between the two countries deteriorated sharply, and China effectively stopped buying Australian coal. Since Beijing launched an informal boycott of Australian coal in October the previous year, global coal flows had to be reshuffled to fill the gap.
As imports from Australia dropped to almost zero, China increased coal purchases from other countries to compensate. Because coal accounts for such a large share of China’s energy mix, securing steady supplies is critical for the country’s energy security.
At the same time, China’s president announced that the country would stop building new coal‑fired power plants abroad and that China aims to become carbon‑neutral by 2060.
Was China trying to use a moment when ports around the world were already overloaded to cut coal imports faster and accelerate the transition to renewables? It is hard to say. It sounds good in theory, but in practice it is extremely difficult to do — although, with China, you can never completely rule anything out.
In short: the supply chain was broken in several places:
- at the production level (factories, power supply),
- and at the logistics level (ships, ports, inland transport).
Whether and when everything would fully return to “normal” was impossible to predict at the time. One thing was clear, though: the consequences of this period were being felt — and would continue to be felt — by everyone in the supply chain, including end consumers.
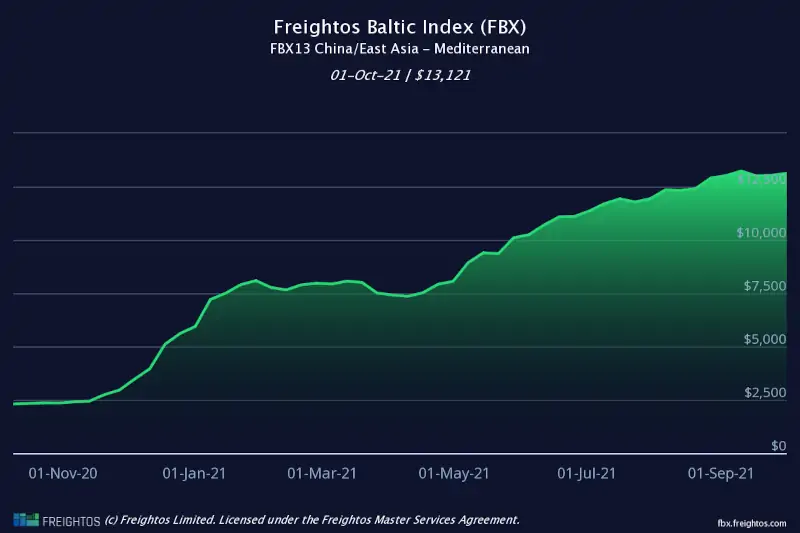
Price comparison: China – Mediterranean 2020–2021
To wrap up, here is a comparison of container freight rates from China to the Mediterranean between 01.11.2020 and 30.10.2021.
How to look at this period today
The 2020–2021 period showed us:
- how strongly global shocks can push up container freight rates,
- and how quickly logistics costs can eat into an importer’s margin.
Today, freight rates are at very different levels than at the peak of the crisis, but they are still sensitive to:
- seasonal peaks,
- geopolitics,
- and swings in demand.
If you want to understand which components make up today’s container price (BAF, CAF, THC, local charges), how a forwarder’s quote is structured, and when it makes more sense to use LCL instead of FCL, take a look at our complete guide to shipping from China.
Shipping Guide
Complete guide for shipping goods from China
A detailed overview of the goods journey from factory to your warehouse: shipping stages, realistic delivery times (45–60 days), the role of freight forwarders, cost structure, and the most common mistakes importers make when organizing logistics.
Containers for Shipping from China
Container types (20ft, 40ft, 40ft HC, Open Top, Flat Rack), their dimensions, volume, and capacity, plus tips on how to choose the right container and pack your goods properly.
Incoterms 2020
A guide to Incoterms 2020 from the importer's perspective: the difference between EXW, FOB, CIF, DAP, and DDP, who pays for which part of the journey, when risks transfer, and why we most often recommend FOB or DAP to beginners instead of the "cheapest" options.
Quality control
Go back to our guides on product quality control in China.
← Back to Quality controlBack to: ← Shipping from China
Back to: ← China sourcing – start here